The Hexagon, the Decagon, and the Sunflower
On September 2nd, 2026, a peer-reviewed paper in Science Advances confirmed something amateur astronomers had already found with backyard telescopes: a ten-sided wave, the "Decagon," circling Saturn's south pole. Saturn's north pole has had a six-sided twin — the Hexagon — since Voyager first saw it in the early 1980s. Two poles, two stable geometric storms, one planet. It is tempting to reach for a single grand explanation. The honest version of this story is more interesting than that: it takes three separate branches of mathematics to explain a hexagon, a sunflower, and a honeycomb — and the model that best explains Saturn's own Hexagon never saw the Decagon coming.
1. The Hexagon Nobody Could Explain for 40 Years
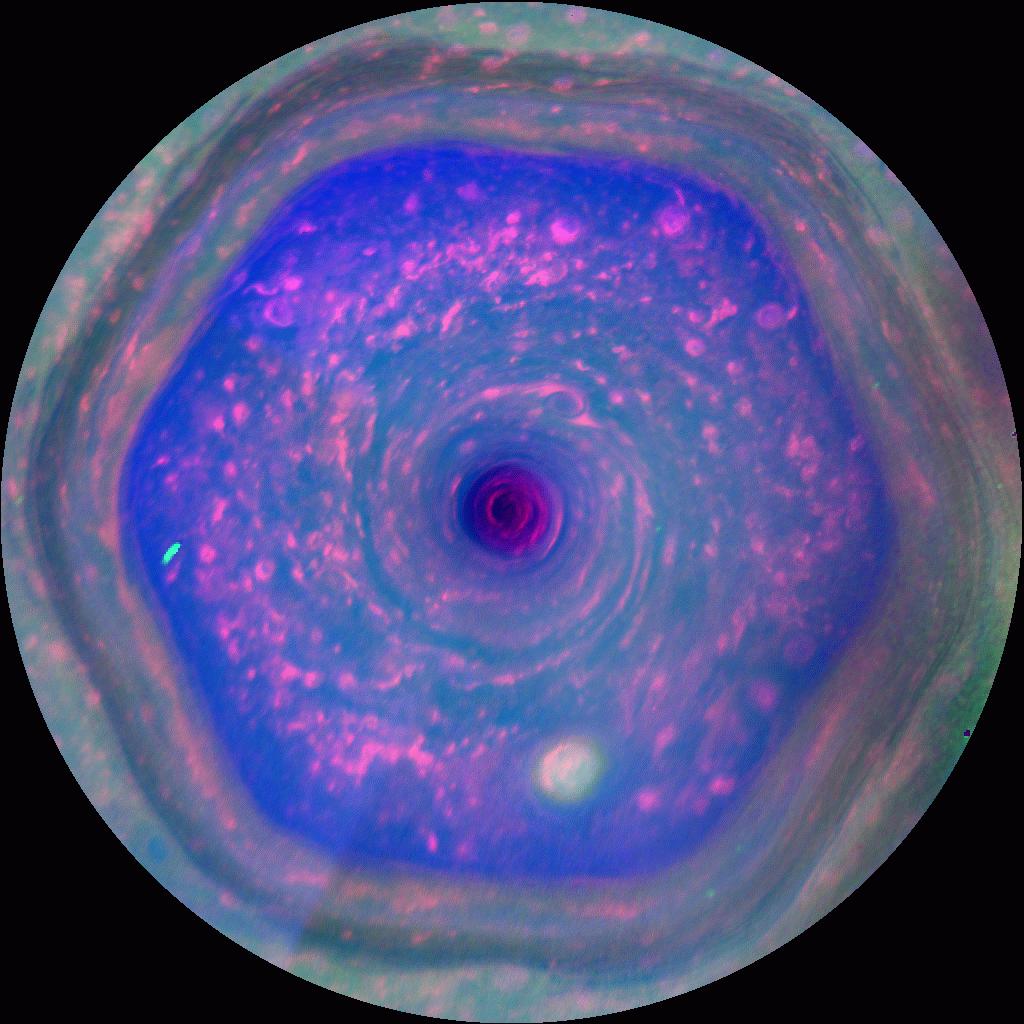
Saturn's north polar Hexagon, ~13,800 km per side — larger than Earth. Cassini, false-color composite. Source: NASA Photojournal (PIA17652).
Voyager first photographed the Hexagon at roughly 76-77.5°N in the early 1980s. It penetrates at least to the 2-4 bar level of Saturn's troposphere, and it has barely changed since — an unusual amount of stability for any atmospheric feature. For decades the leading theory was that a single, permanent vortex sitting next to the jet stream was forcing a stationary wave, like a rock in a river. It was a tidy explanation. It also turned out to be wrong: repeated measurements of that "permanent" vortex kept catching different spots at different times — not one object, just whatever storm happened to be nearby when someone looked.
The explanation that has held up since 2010 is less poetic but far better supported: the Hexagon is what happens when a fast, narrow jet stream becomes barotropically unstable — unstable due to its own internal velocity shear, with no outside vortex required. Oxford researchers built a physical model of this in a bucket of water, and it is worth walking through, because the mechanism turns out to explain far more than one planet's weather.
2. The Lab That Grew a Hexagon in a Water Tank
Ana Barbosa Aguiar and Peter Read's team placed a 60cm cylinder of water on a slowly rotating table, with a narrower ring inside spinning at a different speed — a miniature jet stream, tracked with fluorescent dye. Two numbers controlled everything that happened next: the Rossby number (the strength of the speed difference relative to the Coriolis force) and the Ekman number (viscous drag relative to Coriolis force).
Push the Rossby number past a critical threshold and the flow stops behaving like a smooth ring. It folds itself into a polygon. And here is the counterintuitive part: the larger the speed difference, the fewer sides the polygon has. More force produces less complexity, not more. Across a wide range of settings, six sides was the most common, stable outcome — and at the most extreme speed differences, the pattern collapsed to two or three sides and turned chaotic.
This was not just a nice visual analogy. Aguiar and Read took Saturn's actual measured wind profile — from independent Voyager cloud-tracking data, nothing to do with their tank — and ran it through the same instability mathematics. With a realistic Rossby deformation radius, the equations predicted a fastest-growing wavenumber of 5 to 6. The observed Hexagon: six sides. That is a quantitative prediction from real planetary data landing almost exactly on the observed answer, not merely "these look similar."
There is an honest asterisk on this result that matters for what comes next: the same experiments showed intransitivity — identical Rossby and Ekman settings could sometimes settle into different, equally stable polygon counts, depending on the flow's history rather than its current conditions alone. Which shape you get is not purely determined by the present state of the system. It carries memory.
3. The Decagon Nobody Predicted
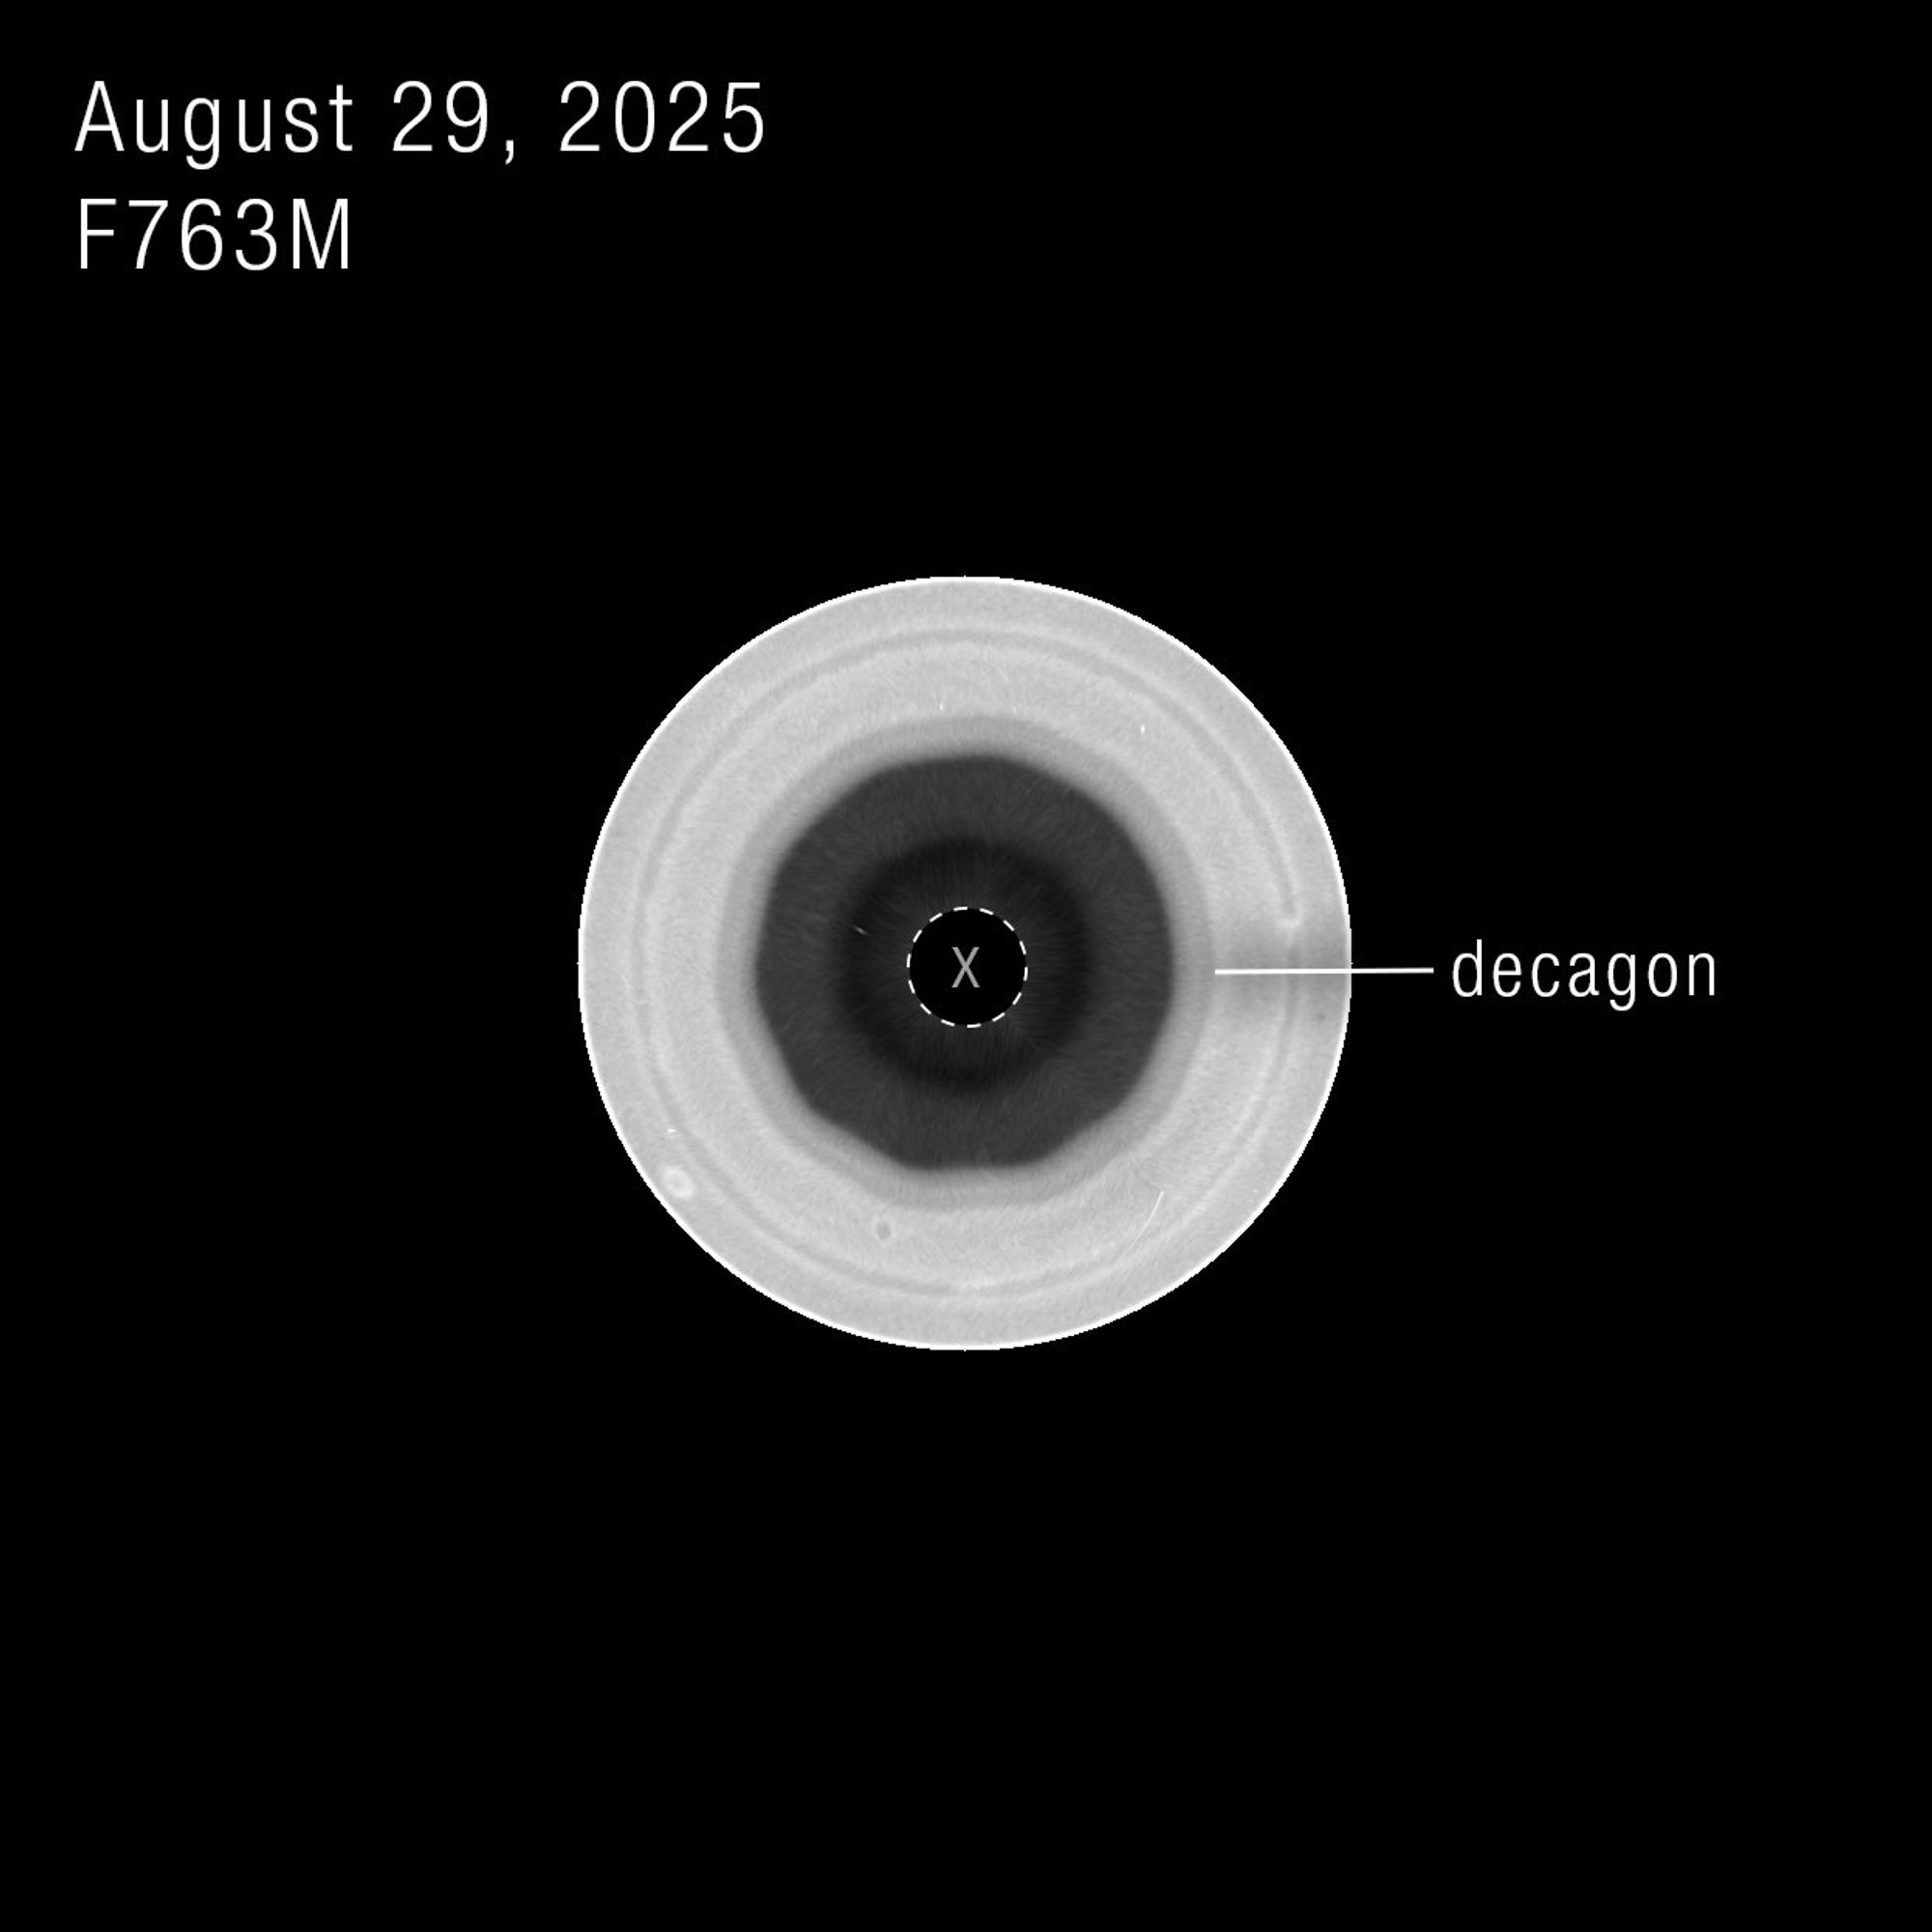
The Decagon, Saturn's south pole. Hubble Space Telescope, filter F763M, 29 August 2025. Source: NASA.
Here is where the story gets genuinely unresolved. Hubble had faintly captured a ten-vertex shape as early as 2023 without anyone recognizing it. Amateur astronomers Trevor Barry (Australia) and Jean-Paul Oger (France) spotted a wavy band around the south pole with their own backyard telescopes in 2024. By summer 2025, Oger had mapped his own images into a clear ten-sided figure. That amateur work fed directly into the professional follow-up, and both Barry and Oger are named co-authors — alongside lead author Agustín Sánchez-Lavega, Amy Simon (NASA Goddard), and Michael Wong (UC Berkeley) — on the paper that confirmed it.
The Decagon sits around 60°S, roughly 17,000 km per side — larger than the Hexagon and farther from the pole, which is why it's easier to see from Earth. Unlike the four-decade-stable Hexagon, it drifts eastward and appears to be only a few years old, still strengthening. That is a genuinely rare opportunity: watching a planetary-scale standing wave form, instead of arriving after the fact to a pattern that has already settled.
And it directly contradicts the 2010 model's own prediction. Aguiar and Read ran their instability analysis on the southern polar jet too, using the data available at the time, and found a growth rate that never peaked at any wavenumber — weaker and unstructured, consistent with the complete absence of a southern hexagon back then. Cassini had already spotted brief, unstable "pinwheel" patterns near the south pole, but nothing that held together. Fifteen-plus years later, something did hold together, and grew. Co-author Amy Simon put the open question plainly: "The most intriguing part to me is that this seems to have just formed recently. The question is, why did it suddenly form now when we haven't seen one before?"
Two honest, non-competing explanations are on the table. One is the model's own intransitivity caveat — a different flow history can settle into a different stable pattern even under similar conditions. The other is Saturn's 29-year seasonal cycle: the south pole was largely turned away from sunlight and from Earth-based observation between 2012 and 2023, so the "weak, unstructured" southern jet measured back in 2010 may simply not describe what is happening there today. Neither answer is confirmed. The discovery paper documents the pattern; it does not yet explain why now.
4. Same Planet, Two Poles — And the Same Question on Earth
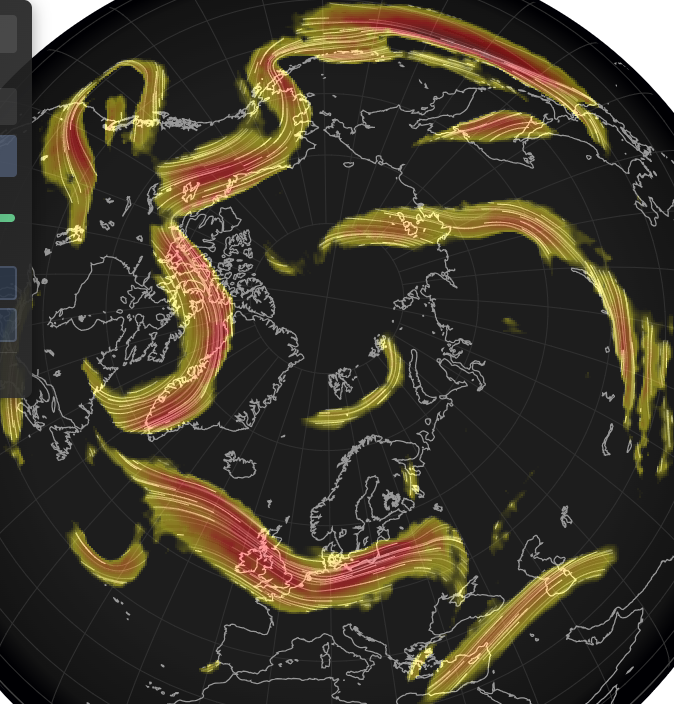
Northern jet stream: fragmented, multiple strands, reaching toward the equator and back.
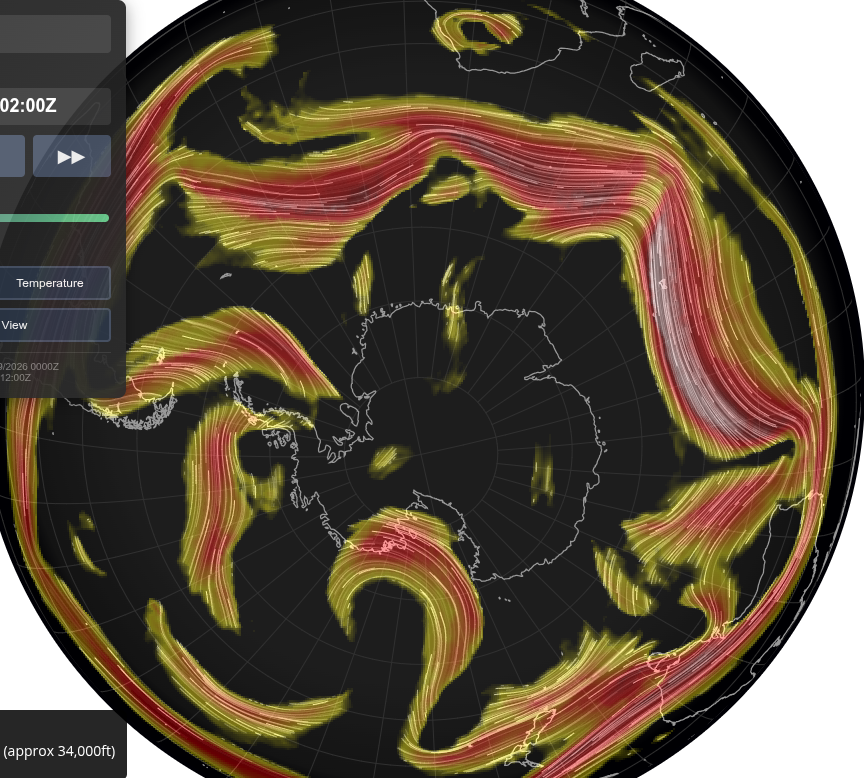
Southern jet stream: closer to a single, continuous ring around the pole.
~250hPa (~34,000 ft) wind visualization, 5 September 2026. Source: Netweather.tv Global Jetstream.
Earth's own polar jet streams show the identical north/south asymmetry, and it is a genuinely useful comparison — as long as the mechanism isn't assumed to be the same one. It isn't, and the difference is the interesting part.
The Southern Hemisphere's jet is more zonally symmetric largely because there is almost no land mass at those latitudes — just the Southern Ocean ringing Antarctica. Nothing forces the jet off its circular path. The Northern Hemisphere jet, by contrast, is constantly deflected by continents: the Rocky Mountains, the Tibetan Plateau, the sheer land-versus-ocean thermal contrast across North America and Eurasia. Fixed geography locks in fixed troughs and ridges, which is a fundamentally different cause than Saturn's free-floating, unforced instability. Saturn has no continents to run into. Earth's northern jet is fighting them constantly.
There is a second, actively debated factor layered on top: the Arctic-amplification hypothesis (Jennifer Francis and colleagues, since 2012) proposes that a warming Arctic shrinks the temperature difference between the pole and the equator, weakening the jet and making it wavier — larger excursions toward the equator and back. This is not settled science, and there are real published counterarguments. But conceptually, it is the same underlying idea as Saturn's story: change the driving gradient, and the wavenumber or amplitude of the resulting instability changes with it. Saturn's driver is a velocity difference (barotropic). Earth's proposed driver here is thermal (baroclinic) — and even the 2010 Hexagon paper concedes Saturn's own pattern is likely a mix of both mechanisms, not a pure case of either.
| Saturn's poles | Earth's poles | |
|---|---|---|
| What breaks symmetry | Nothing needed — free instability of the jet itself | Continents, land-sea contrast (primary); a weakening thermal gradient (proposed, debated) |
| Result | Clean, standing polygon (6 or 10 sides) | Fixed, recurring meanders (north) vs. a near-continuous ring (south) |
| Underlying math | Barotropic instability, wavenumber selection | Same family of Rossby-wave dynamics, forced rather than free |
5. Three Different Kinds of Math — Not One Grand Pattern
It's tempting, once you've seen a self-organizing hexagon on a gas giant, to start seeing "the pattern" everywhere and conclude it's all one phenomenon. That would overclaim the mathematics. What's actually true is narrower and, if anything, more interesting: nature repeatedly falls back on a small number of distinct mathematical principles, because each one happens to be the only stable or efficient outcome available — not because there's one hidden master pattern connecting them.
A. Instability with wavenumber selection
Saturn's Hexagon and Decagon belong to this class: run a linear instability analysis on a velocity or vorticity profile, plot growth rate against wavenumber, and whichever wavenumber grows fastest wins and becomes the visible pattern.
Alan Turing described the same mathematical step in a completely different medium in 1952: two chemicals diffusing at different rates, one activating and one inhibiting, produce a spontaneous periodic pattern — stripes, spots, or polygons — from a perfectly uniform starting state. The dispersion-relation math is the same shape as Saturn's growth-rate curve. The physical substrate — atmospheric vorticity versus chemical concentration — is not. Turing-style reaction-diffusion models are used to explain leopard spots, zebra stripes, and the branching patterns of roots and leaf veins.
B. Geometric efficiency — a proven optimum, no instability involved

The honeycomb, and structured water's hexagonal lattice, share a completely different kind of explanation: a hexagon is mathematically proven — the "honeycomb conjecture," proven by Thomas Hales in 1999 — to be the shape that tiles a plane using the least perimeter per unit of area. There is no instability to trigger and no growth curve to solve. Any system minimizing material or energy while covering a surface will find its way to a hexagon on its own, because nothing more efficient exists.
C. A growth rule that happens to be mathematically unbeatable
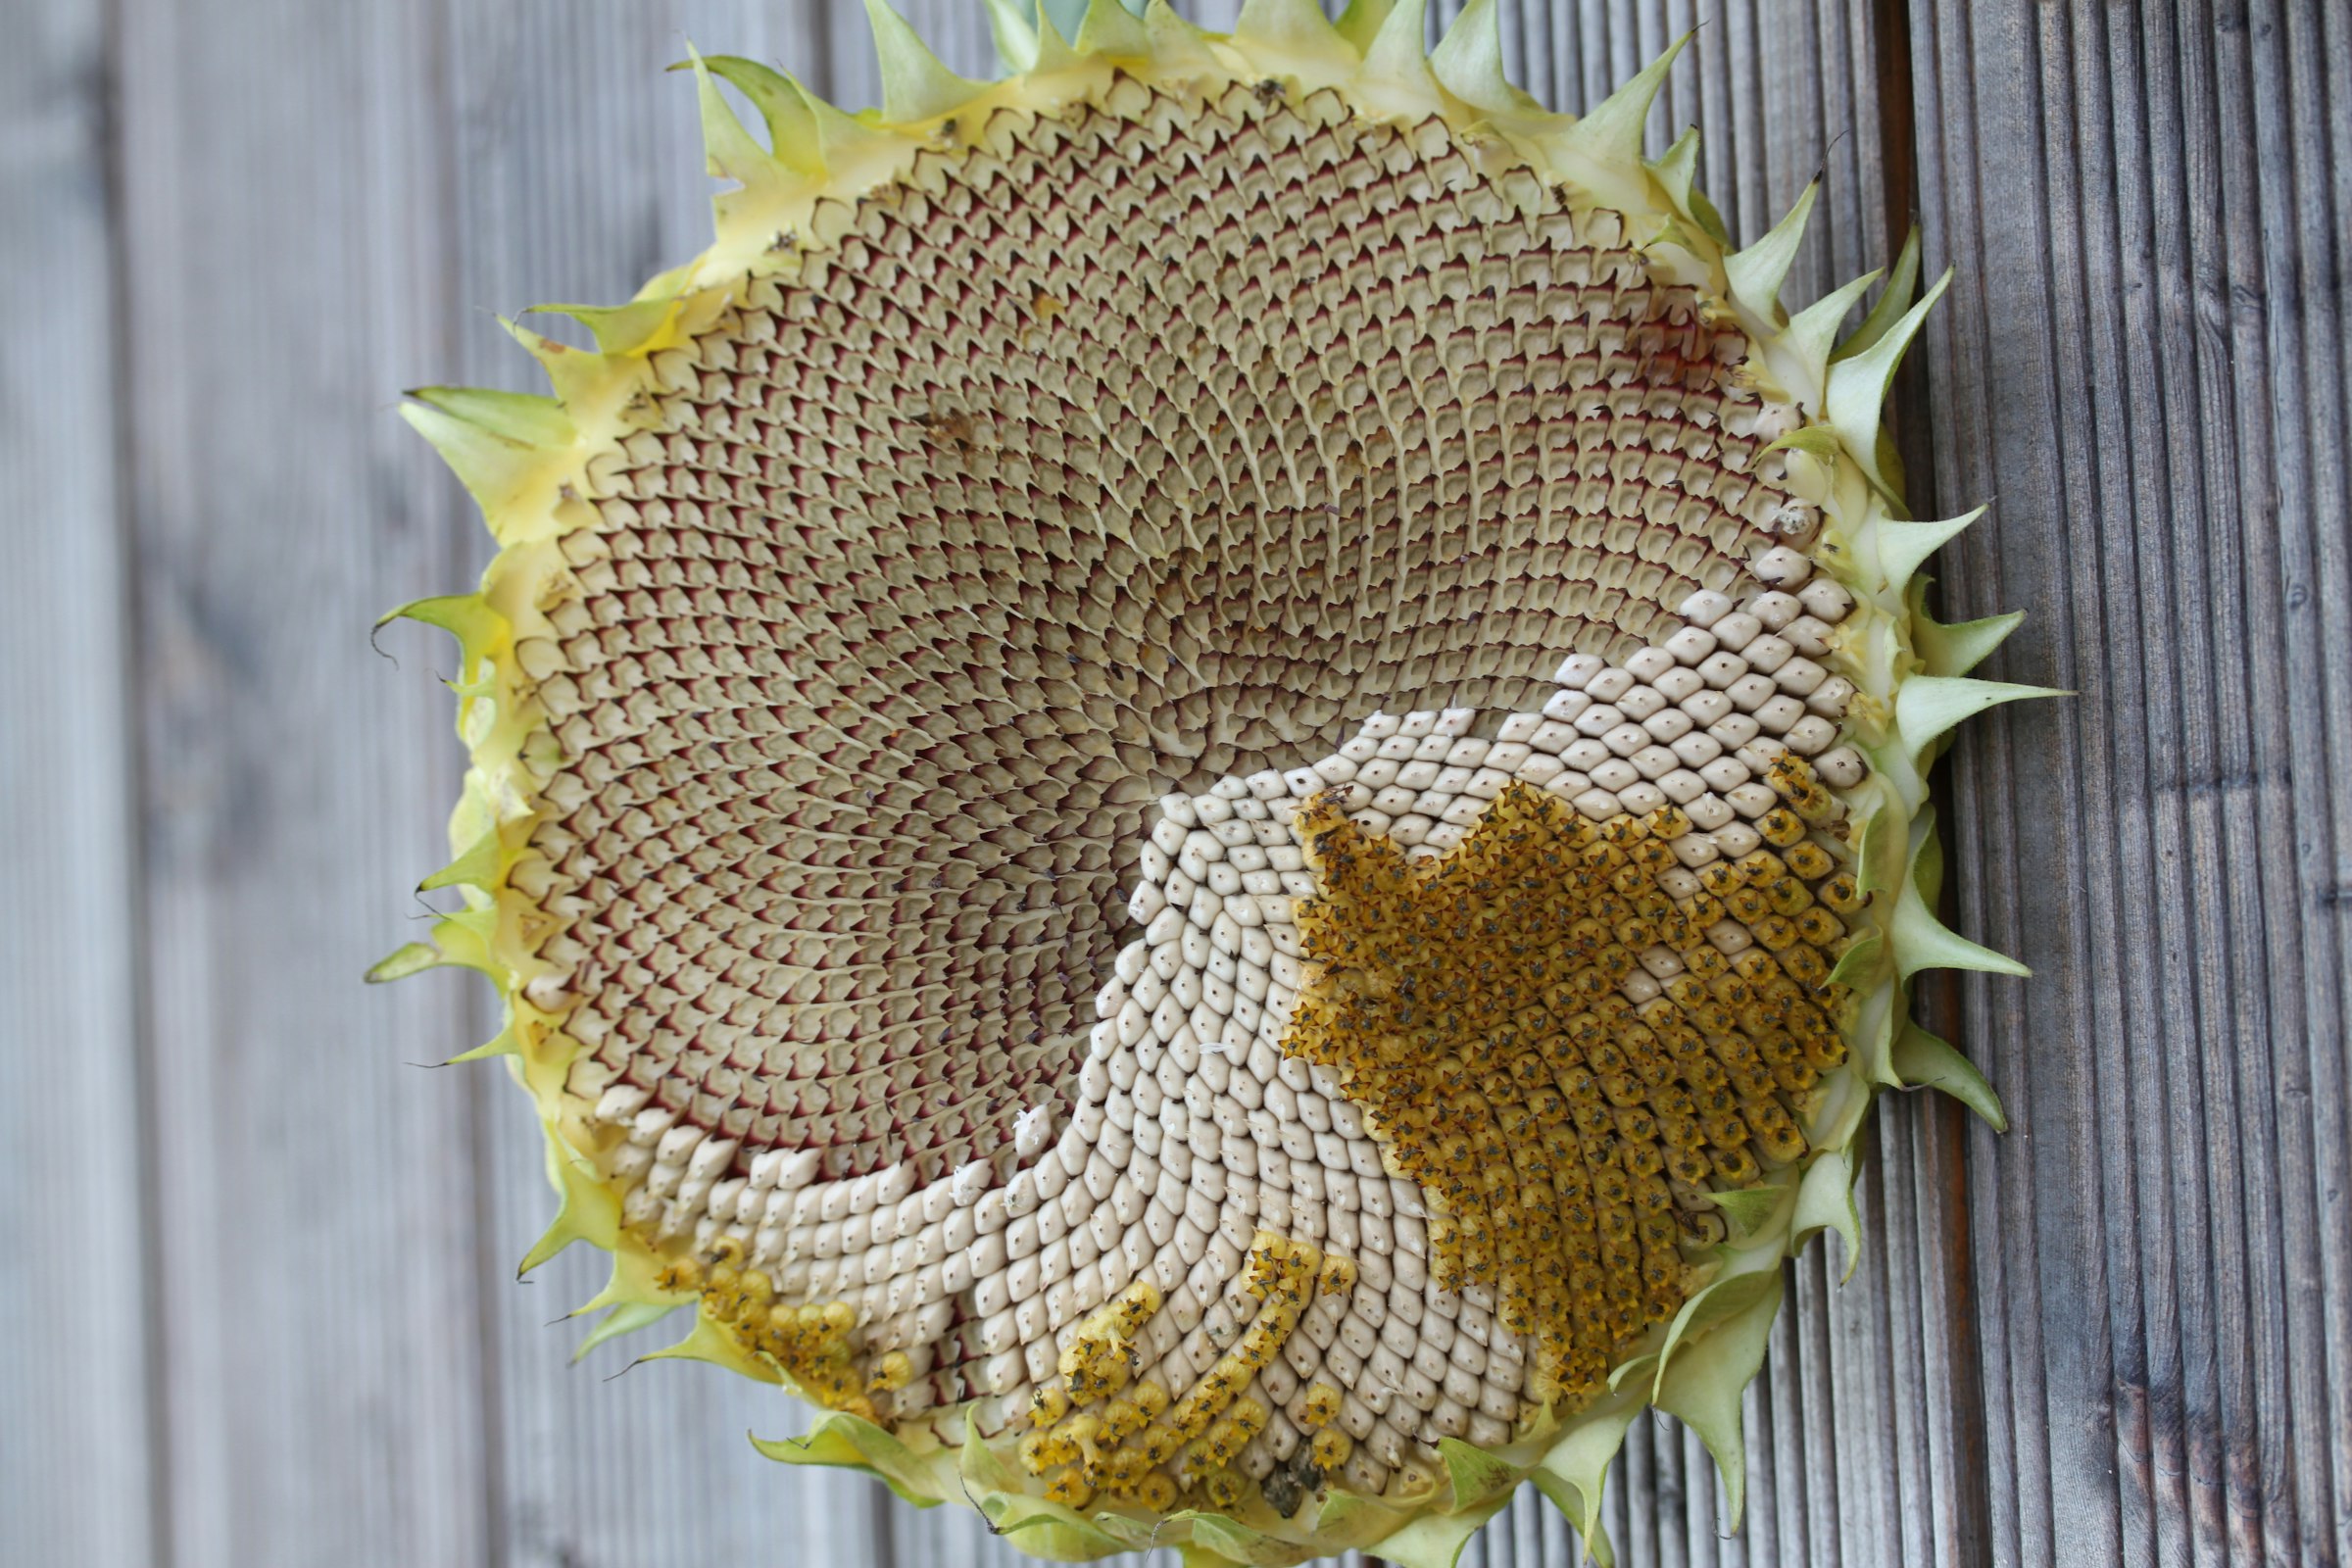
Phyllotaxis — the ~137.5° golden angle at which sunflower seeds, pinecone scales, and leaves arrange themselves around a stem — is neither an instability nor a geometric theorem. It's a growth rule that natural selection enforces after the fact: that specific angle permanently minimizes overlap between successive elements. Any plant whose mutation nudges it to a different angle packs its seeds or leaves less efficiently, captures less light or space, and loses out to neighbors that didn't drift. No design, no physical instability — just a mathematical inevitability that competition relentlessly selects for.
Three separate reasons, one recurring impression.
A hexagonal jet stream on Saturn, a leopard's spots, a honeycomb, and a sunflower's seed head are not expressions of one universal law of nature. They are three separate, well-understood pieces of mathematics — instability-driven wavenumber selection, a proven geometric optimum, and an evolutionarily enforced growth angle — that keep producing the same small family of shapes, simply because those shapes are the only stable, efficient, or competitive outcomes available. The pattern is real. The explanation is not singular, and treating it as singular is where good observation turns into bad physics. What's left, once the three are kept separate, is still remarkable: three independent branches of mathematics, none of them designed with the others in mind, keep arriving at the same handful of shapes anyway.
Sources
- Barbosa Aguiar, A.C., Read, P.L., Wordsworth, R.D., Salter, T. & Yamazaki, Y.H. "A laboratory model of Saturn's North Polar hexagon." Icarus 206(2), 755-763 (2010). DOI: 10.1016/j.icarus.2009.10.004.
- Sánchez-Lavega, A. et al. "A decagon wave around Saturn's south pole." Science Advances 12, eaee4251 (2026). DOI: 10.1126/sciadv.aee4251.
- NASA Science, "NASA's Hubble Tracks New Decagon Encircling Saturn's South Pole," September 2026.
- Rodriguez-Imazio, P. et al. "Deep rotating convection generates the polar hexagon on Saturn." PNAS 117(37) (2020). DOI: 10.1073/pnas.2000317117.
- Turing, A.M. "The Chemical Basis of Morphogenesis." Philosophical Transactions of the Royal Society B, 1952.
- Hales, T.C. "The Honeycomb Conjecture." Discrete & Computational Geometry 25, 1-22 (2001; proof completed 1999).
- Francis, J.A. & Vavrus, S.J. "Evidence linking Arctic amplification to extreme weather in mid-latitudes." Geophysical Research Letters, 2012.
- Global jet stream visualization, 5 September 2026: netweather.tv/charts-and-data/global-jetstream.